Introduction
Many traffic command centers begin as a room with a video wall and a grid of camera feeds. That arrangement lets people watch. Traffic authorities need to act: confirm an accident, dispatch a response, review violations, issue challans, and report on what happened during the shift.
A CCTV viewer is organised around cameras. An ITMS dashboard is organised around events: what happened, where, how urgent it is, what evidence exists, and what the operator should do next. That difference shapes every screen.
The operational problems a dashboard addresses are familiar to anyone who has spent time in a control room. Operators cannot watch hundreds of feeds at once. Alerts arrive from separate systems with no common priority. Evidence sits in different places. Context gets lost at shift handover. Cameras go offline and remain unnoticed until someone needs footage from them. A well designed ITMS dashboard is the layer that brings these threads into one working surface.
What a Modern ITMS Dashboard Must Achieve
The core job has four parts.
Situational awareness. Operators need an accurate picture of the network right now: traffic state on key corridors, open incidents, and which cameras and sensors are actually working.
Prioritised alerts. Every detection competes for the same limited attention. The dashboard has to rank events so the most consequential ones reach an operator first.
Evidence packaging. Violation detections become useful only when they are assembled into records an enforcement officer can approve and defend.
Decision support. For incidents, the dashboard should present the supporting video, location, and standard procedure so the operator can decide quickly and consistently.
Indian conditions raise the difficulty of each part. Mixed traffic and non-lane discipline generate a high volume of detections, and some of them are ambiguous. Lighting varies sharply between morning glare, monsoon rain, and poorly lit stretches at night. Links from junctions drop and recover, so data can arrive late. A dashboard has to represent all of this honestly, including how fresh each piece of information is. Katomaran's intelligent traffic management system is built around these requirements.
Live Traffic Overview and Map Layer
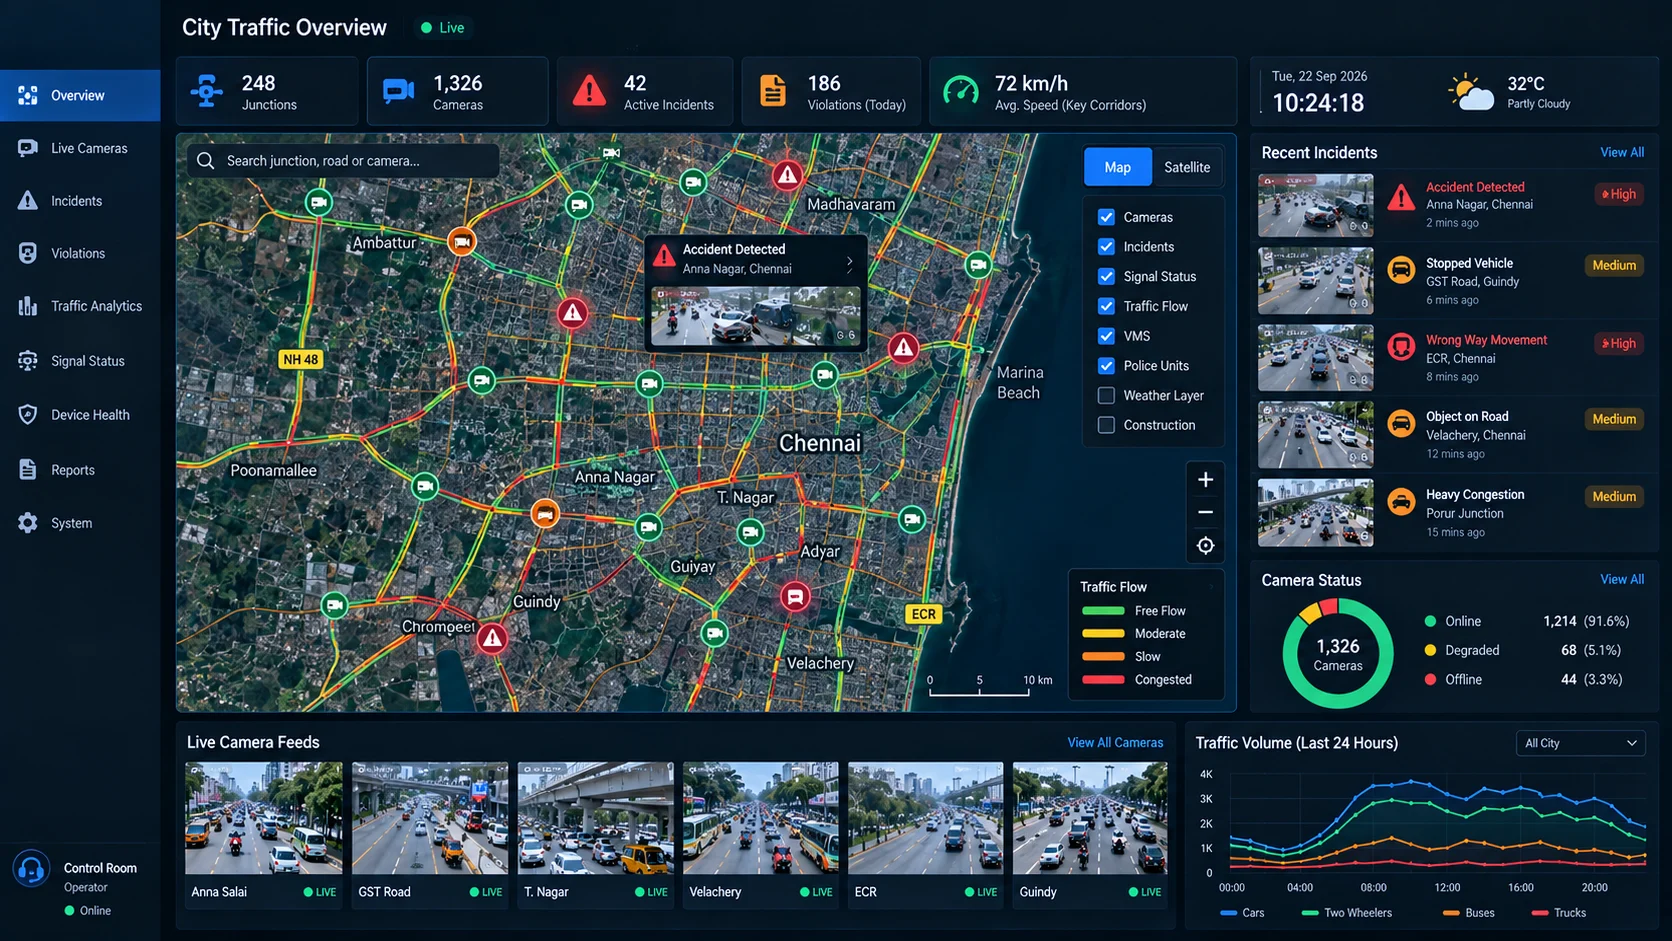
The map is the operator's orientation layer. It shows junctions, camera locations, corridors, and open events on a GIS base, and it should answer one question at a glance: where do we need to look?
Camera and device status. Each device needs a small set of clear states: online, degraded, and offline. Degraded covers conditions such as low bitrate, a blurred or tampered view, or a camera knocked out of position. Every status should carry a last-seen time. When a junction loses power, the map should show that site as one fault with several affected devices, which is easier to act on than a scatter of separate camera alarms.
Congestion indicators. Real-time traffic monitoring data, such as vehicle counts, queue lengths, and travel times derived from ANPR matches, can be shown as segment colours. Colour alone is unreliable in a bright room and for colour-blind operators, so each state should also carry a text label or pattern.
Corridor views. For arterials and highways, a linear strip diagram showing successive junctions or camera points in order is often clearer than a zoomed map. Operators can follow a queue building from one junction to the next without panning. This view suits the long, sequential layouts discussed in our article on ITMS for highway corridors.
Keeping it readable. The default view should show exceptions, and routine status should stay quiet. Markers should cluster at city scale and expand on zoom. Data layers such as signals, cameras, and incidents should be switchable. Stale data should be visibly greyed with its timestamp, so an operator never mistakes a delayed reading for current conditions. Where signal controllers report their state, the map can show that too, which becomes useful once adaptive traffic signal control is part of the network.
Alert and Event Prioritisation Engine
A city network produces far more events than a shift can handle one by one. The prioritisation engine decides what interrupts an operator, what waits in a queue, and what is merged or suppressed.
Events fall into three broad classes, and they behave differently:
Safety incidents such as accidents, stopped vehicles in live lanes, and wrong-way movement need attention within minutes and should interrupt the operator.
Enforcement violations such as helmet, red light, and speed violations need careful review, but they can wait in a queue and be processed in batches.
System health alerts such as camera, network, power, and storage faults need to reach maintenance staff, grouped by root cause.
Within each class, ranking draws on several factors:
- the type of event and its inherent severity
- location context, such as a flyover, a high-speed corridor, or a school zone during school hours
- detection confidence
- time sensitivity
- whether the event duplicates one already open
Deduplication matters more than it first appears. A stopped vehicle seen by three cameras should become one event with three views attached.
Every alert needs an acknowledgement, and every dismissal needs a reason code. Unacknowledged high-priority events should escalate to a supervisor after a defined interval. Dismissal reasons are also the main tuning input. When operators repeatedly dismiss stopped-vehicle alerts at a known autorickshaw stand, that zone needs adjusting.
Indian roads add some specific needs. Roadside stops, cattle, and processions are routine at certain places and times. The engine should support schedule-based rules and temporary suppression zones. Each change should be approved by a supervisor and recorded in the audit log.
Violation Evidence Workspace
The evidence workspace is where detections become enforceable records. It is a review tool, and it should be designed for accurate, steady throughput.
Each record should present, on one screen:
the overview image showing context
the close-range image with the plate crop
the ANPR read and its confidence score
a short timestamped clip from before and after the trigger
the location, camera identifier, and rule applied
Some violation types need extra elements. Red light records need the signal phase at the moment of stop-line crossing. Point speed records need the measured speed and a calibration reference. Section speed records need both the entry and exit reads with their timestamps.
The reviewer's actions should be few and explicit:
- approve
- correct the plate
- reject with a reason code
- escalate
A plate correction must keep the original read alongside the correction, with the reviewer's identity. Where the registration lookup returns a vehicle class that does not match what the camera saw, the record should be flagged, since that mismatch can indicate a cloned or misread plate. Keyboard shortcuts and a fixed layout help reviewers keep a steady pace without mistakes.
The path from detection to enforceable record should be visible as a status on every item: detected, under review, approved, sent to the e-challan system, and acknowledged by that system. Evidence packages should be hashed so any alteration is detectable, and export should be restricted to authorised roles. Our article on ANPR enforcement and the speed evidence workflow covers the evidence chain in more detail.
Incident Detection and Response Panel
Incidents need a different surface from violations, because the operator is managing an ongoing situation.
When a stopped vehicle, accident, wrong-way movement, or sudden congestion event fires, the panel should open with:
live video from the triggering camera
the pre-event clip that caused the alert
the incident's position on the map, with nearby cameras one click away
traffic state upstream and downstream
a timeline of everything logged against the event
Where a PTZ camera covers the location, the system can move it to a preset view automatically.
Event types unfold differently. Wrong-way movement is urgent and moving, so downstream cameras should be surfaced immediately. Congestion builds gradually, and a trend view shows whether it is clearing or spreading. Accidents often lead to secondary events, such as queues and vehicles stopping to look, which should be linked to the primary incident, where they can be tracked together.
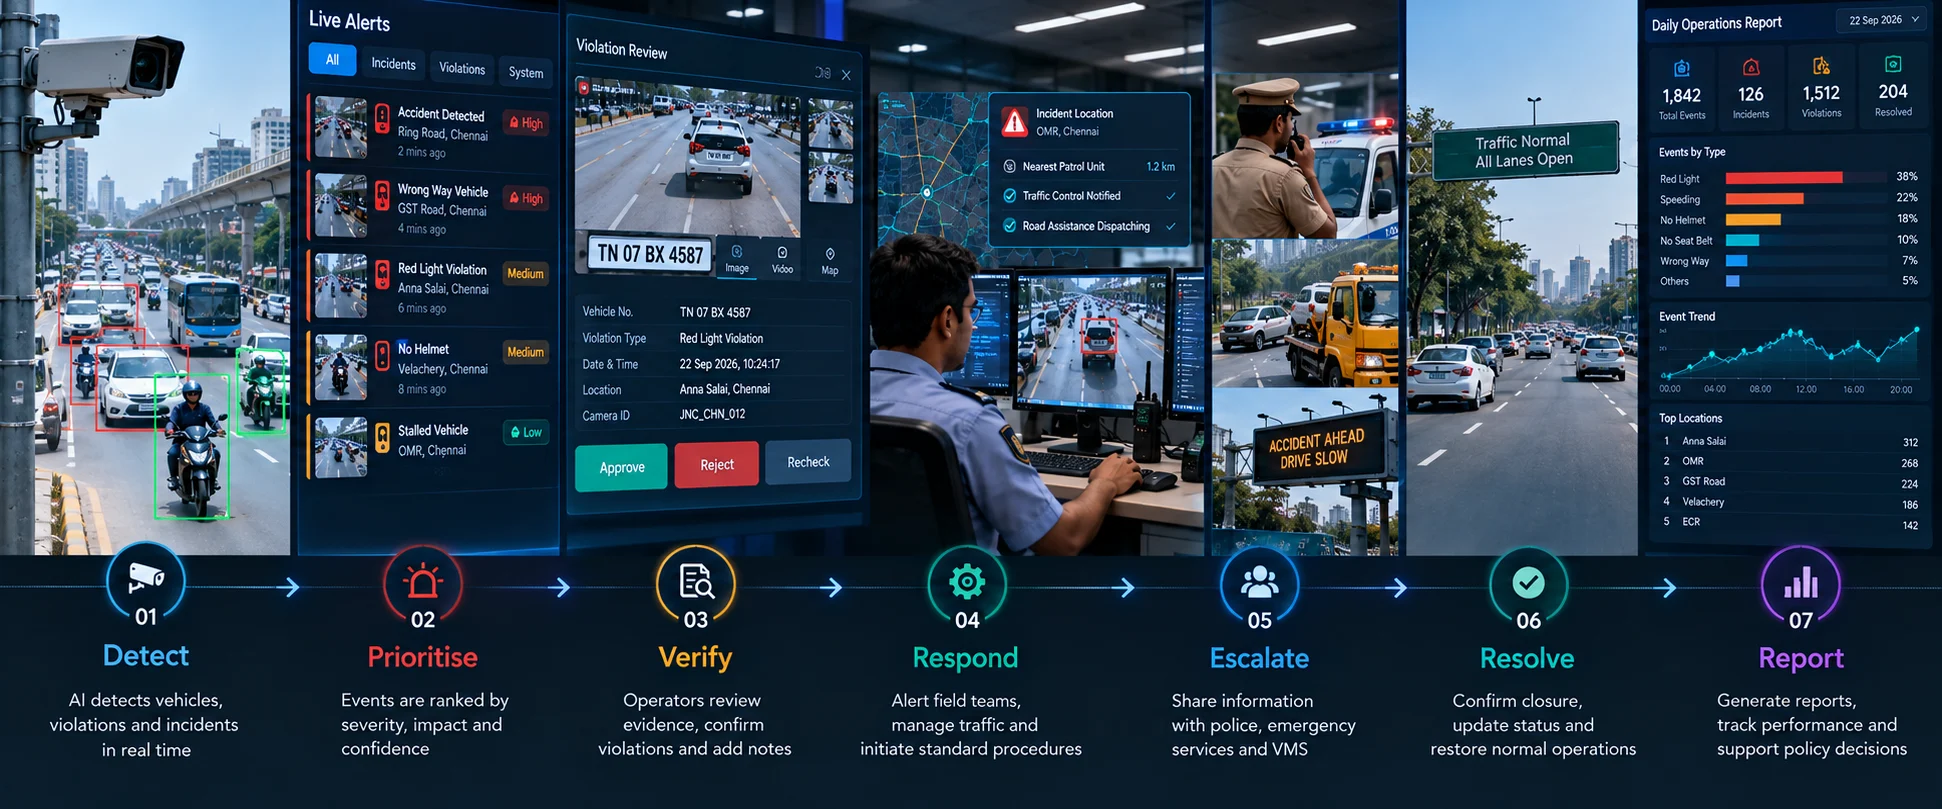
The operator's steps should follow a procedure specific to each event type:
1. Verify the event.
2. Classify it.
3. Escalate to the right agency: traffic police, ambulance services, highway patrol, or towing.
4. Record notes as the situation develops.
5. Close the incident with a resolution entry.
A built-in checklist and contact directory reduce reliance on memory during a busy hour. The full record, including video, becomes the basis for post-incident review.
Operator Workflow and Role Separation
Different people use the same dashboard for different purposes. Clear roles keep them from stepping on each other and keep the audit trail complete.
Monitoring operators watch live views, acknowledge alerts, verify incidents, and do first-level violation review.
Supervisors reassign work, override priorities, approve suppression rules, watch team load, and sign off shift reports.
Enforcement officers give final approval on challans and control evidence export, since they carry legal accountability for those decisions.
Maintenance staff see device health and configuration without access to enforcement evidence.
Everyone works from the same underlying events, with views and permissions matched to the role. Individual logins are essential, because shared accounts create audit gaps that are hard to close later. Every action should record who took it and when.
Two workflow features prevent confusion in multi-operator shifts. The first is event ownership: an operator claims an incident, and others can see it is being handled. The second is structured handover. At shift change, open incidents and pending reviews transfer explicitly, with notes, so the next shift picks up where the previous one stopped.
Integration Points with Existing Systems
A traffic command center rarely starts from nothing. The dashboard has to work with what is already installed, or it becomes one more screen that operators check separately.
VMS. The video management system remains the source for live video and recordings. The dashboard should request streams and playback through the VMS. That avoids duplicate camera connections, saves bandwidth, and keeps recording policy in one place.
Video wall. Incidents can trigger preset wall layouts, so the room sees the relevant cameras without manual rearrangement. Our guide to VMS video wall best practices for command centers covers layout design in more depth.
E-challan systems. Approved violation records should move through an agreed interface, with status returned to the dashboard so reviewers can see what was accepted or rejected.
External agency feeds. Police control rooms, emergency medical dispatch, highway authorities, and signal control systems may all send or receive information. A shared incident record helps all parties refer to the same event.
Standards. ONVIF for cameras, documented APIs for events, and directory-based sign-on reduce custom work and make future changes easier.
The practical test is whether an operator can handle an incident from start to finish without leaving the dashboard for another system's login. Our article on integrating CCTV and ITMS looks at this from the camera side.
Performance and Reliability Considerations for 24×7 Operation
A command center runs continuously, so the dashboard and its pipeline must tolerate the faults that continuous operation brings.
Camera dropouts. The system must distinguish an offline camera from an empty road. Silence from a device should appear as a fault, with its last-seen time.
Late data. Edge units that buffer during outages will send events in bursts when links recover. Those events should carry their original timestamps and appear in correct time order, marked as delayed.
Network jitter. Live video should adapt through lower-resolution streams when bandwidth drops. The rest of the dashboard, including the alert queue, the map, and the review workspace, should stay responsive even while video struggles.
Peak event volumes. Evening peaks, heavy rain, and festival days produce bursts of detections. A queue-based pipeline absorbs these without blocking the interface. When resources are tight, incident processing should take precedence over violation processing.
Redundancy. Server failover, database replication, and backup power for the command center itself should be in place. Operators should also be able to keep working from their desks if the video wall controller fails.
Long sessions. Dashboards that stay open across multiple shifts need testing for memory growth and gradual degradation. Session timeouts should balance security with avoiding disruption during an incident.
Time synchronisation. Every camera, edge unit, and server needs a common time source. Evidence and incident timelines depend on it.
Conclusion
A modern ITMS dashboard turns continuous detection into usable operational decisions. The map shows where to look. The prioritisation engine decides what comes first, the evidence workspace produces records that stand up, and the incident panel guides response. Role separation, integration with existing systems, and reliable 24×7 operation keep all of it dependable on a normal Tuesday night as much as during a crisis.
If you are planning a new traffic command center or reworking an existing one, we would be glad to talk through your control-room layout, operator workflows, and integration requirements.
Frequently Asked Questions
1. How is an ITMS dashboard different from a CCTV viewer?
A CCTV viewer shows cameras. An ITMS dashboard shows events, their priority, their evidence, and the next action. We treat the video as supporting material around each event, which changes how operators work.
2. How does the dashboard stop operators from being flooded with alerts?
We merge duplicate detections, rank events by severity, location, and confidence, and send violations to a review queue. Only safety incidents interrupt the operator. Dismissal reasons then guide rule tuning at each site.
3. Who should approve violation evidence before an e-challan is issued?
We recommend reviewing every uncertain case. Operators handle first-level review, and enforcement officers give final approval. Plate corrections keep the original read, and each evidence package is hashed so any alteration is detectable.
4. What happens on the dashboard when a junction loses connectivity?
Edge units buffer events locally and forward them once the link returns, with original timestamps. The dashboard marks those events as delayed and shows camera last-seen times, so operators always know how fresh data is.
5. What user roles does a traffic command center need?
At minimum, we suggest monitoring operators, supervisors, enforcement officers, and maintenance staff, each with individual logins. Shared accounts create audit gaps. Event ownership and structured shift handover prevent two people acting on one incident.

Caldwell Simon
Project Manager
Caldwell Simon, Project Manager at Katomaran Technologies, writes on AI video analytics, VMS, IoT integration, and large-scale surveillance deployment and delivery.